What is TEAR SHEET: Finance
What Is TEAR SHEET: Finance
What’s interesting, the term tear sheet can have various meanings depending on the industry. In the case of finance, it is a concise summary of a company’s financial performance and key data, typically used by analysts, financial advisors and investors to analyze the investment potential of a company.
In the majority of cases, a tear sheet is a single-paged document. It provides a snapshot of essential information such as financial ratios, stock performance, recent news, and forecasts.
Tear sheets can be particularly useful in the fast-paced world of finance, where quick access to critical data can influence investment decisions.
Components of a tear sheet
Now, we can take a closer look at the components of a tear sheet.
Company Overview
Name and ticker symbol: the company’s full name, as well as the ticker symbol under which its stock is traded.
Industry and sector: What’s important, a tear sheet also includes the industry and sector classification of the company, providing context on its market environment.
Business description: A brief description of the company’s operations. Moreover, the document includes information regarding products or services, helping investors understand its core activities.
Stock information
Let’s not forget about stock.
Current stock price: The documents usually include some stock information. For example, the latest trading price of the company’s stock.
Market capitalization: The total market value of the company’s outstanding shares.
52-week high and low: The documents usually include some data about the highest and lowest stock prices over the past year.
Daily volume: Investors should also expect some information about daily volume.
Financial metrics
It is hard to imagine a tear sheet without information about the financial metrics.
Revenue and earnings: The latest revenue and earnings figures are often compared to previous periods to show growth trends.
Earnings per share (EPS): The portion of a company’s profit allocated to each outstanding share, a key indicator of profitability.
Price-to-earnings (P/E) ratio: A valuation ratio comparing the current stock price to its per-share earnings. It helps to determine if a stock is over or undervalued.
Debt-to-equity ratio: A measure of leverage that expresses the ratio of debt financing relative to equity.
Performance metrics
What else does the document mentioned earlier include? Performance metrics!
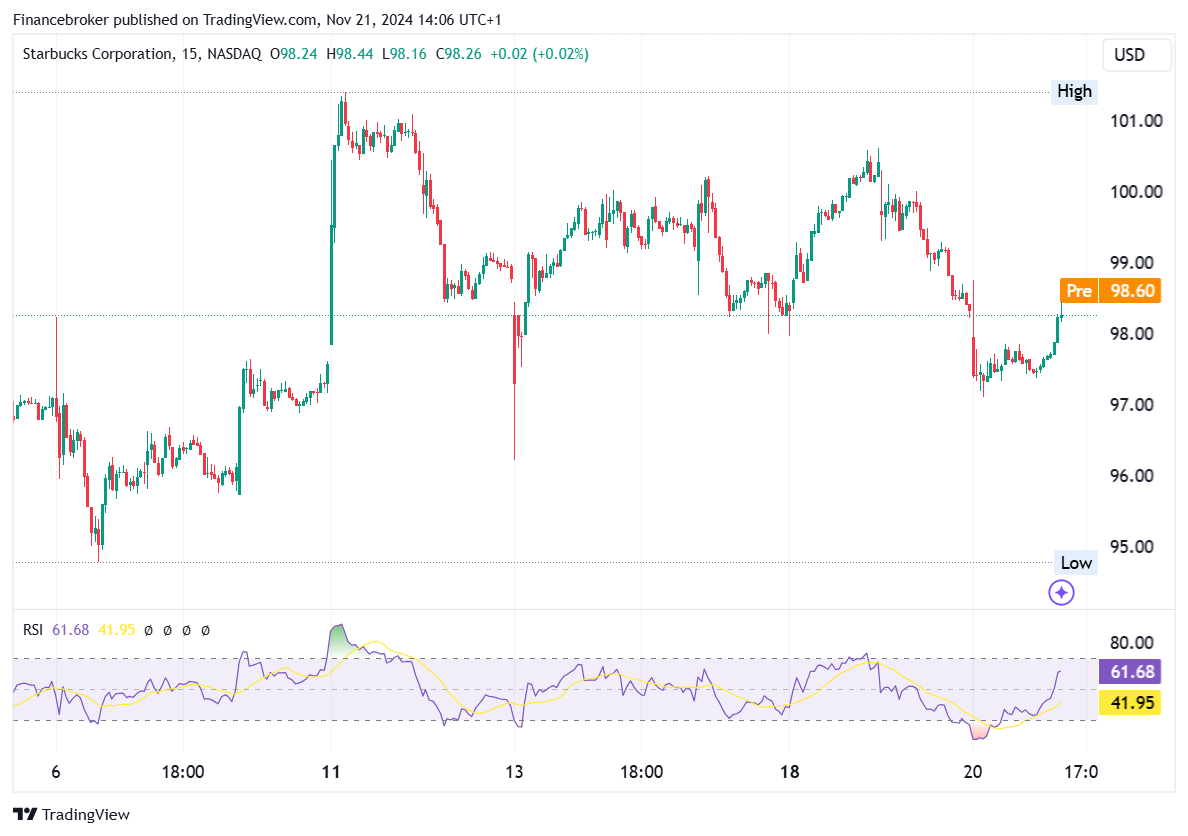
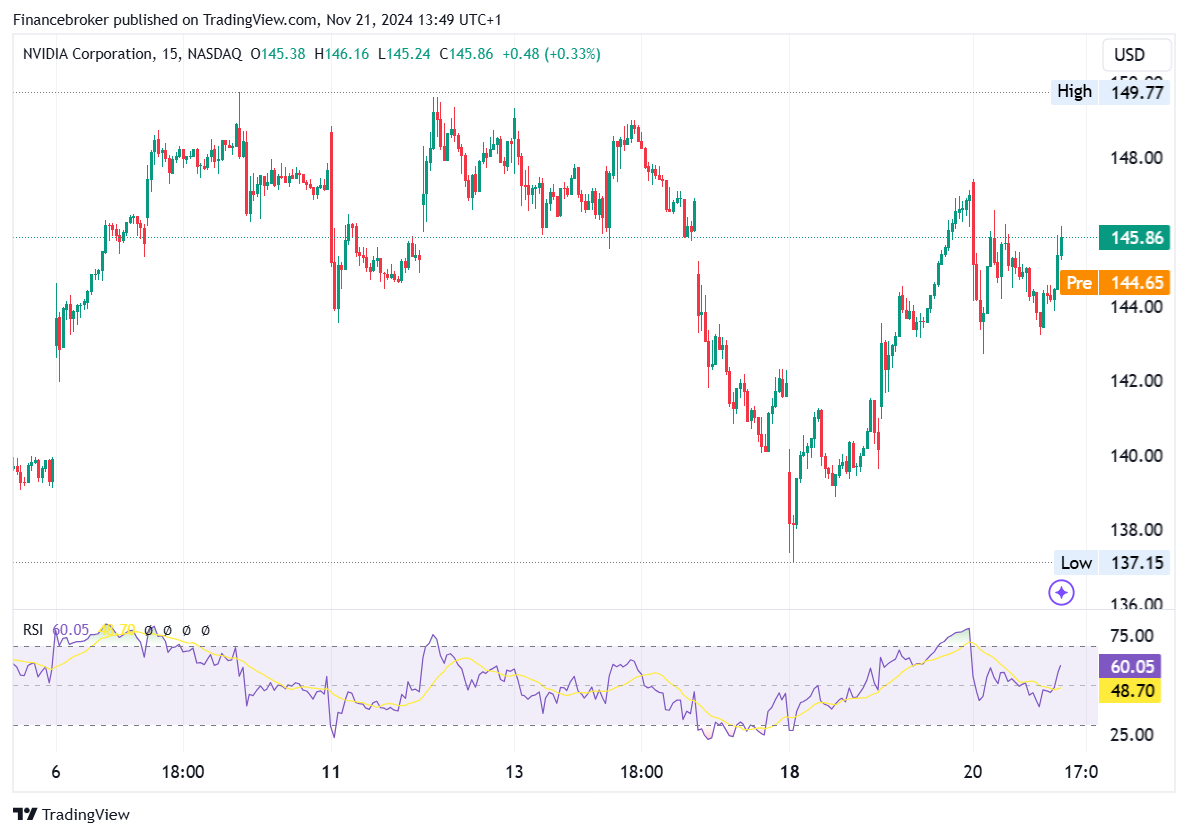
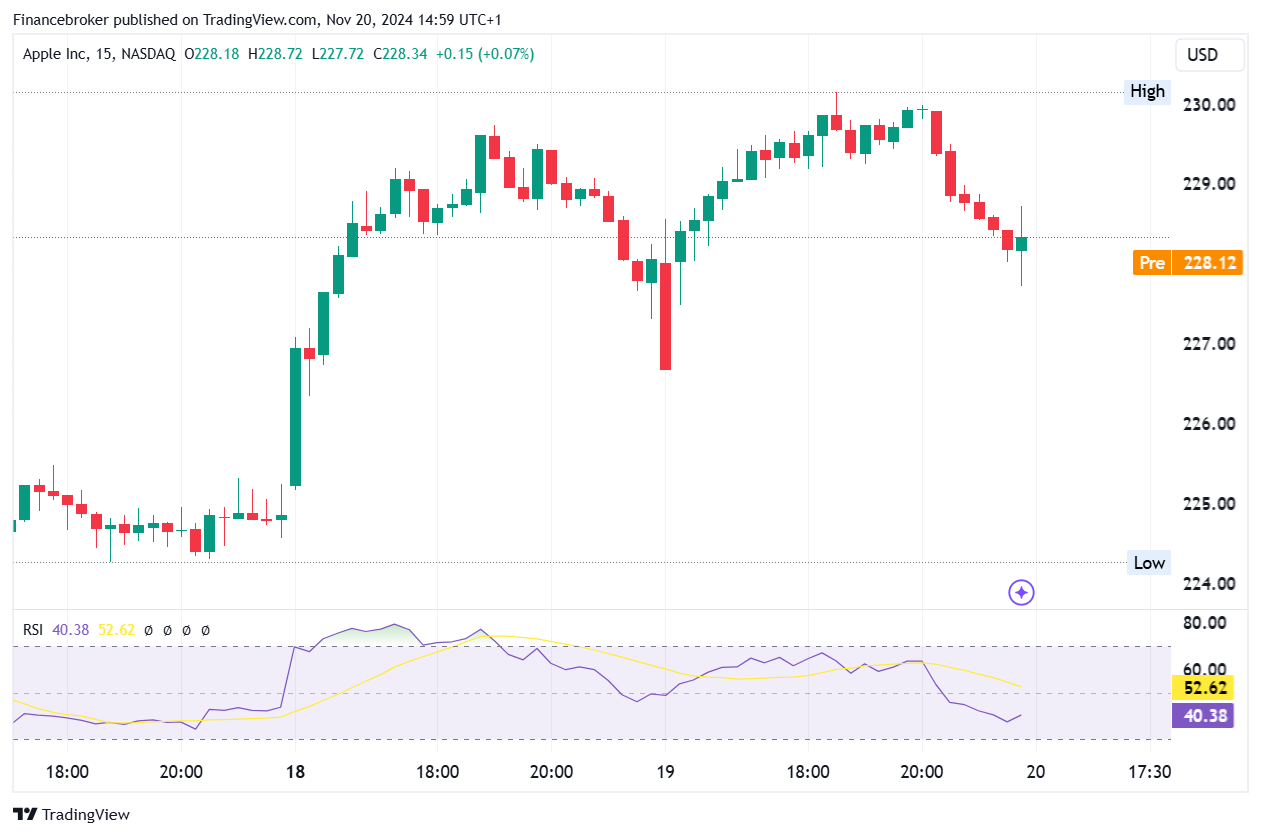
Stock performance graph: A visual representation of the stock’s performance over a specific period.
Comparative benchmarks: Performance against industry benchmarks or indices, providing perspective on relative performance.
Analyst ratings and recommendations
Consensus rating: The average rating from financial analysts.
Target price: Analysts’ forecasted price for the stock. It is important to pay attention to a target price.
Recent news and developments
News highlights: Summaries of recent news articles or press releases. News articles and press releases have the potential to impact the company’s performance.
Corporate actions: Information on recent or upcoming corporate actions. For instance, stock splits, mergers, etc.
Forecasts and estimates
Earnings estimates: The document usually mentions earnings forecasts, providing expectations for the company’s financial performance.
Revenue Estimates: Projected revenue figures. The data mentioned earlier helps investors to measure growth potential.
Significance of tear sheets
Efficiency: They provide a quick and efficient way to access important financial information without delving into lengthy reports or other documents.
Comparability: Thanks to such documents, investors can easily compare multiple companies side-by-side, facilitating better investment decisions.
Focus: They summarize the most relevant information, helping investors focus on critical metrics and avoid information overload.
Accessibility: Designed for easy understanding, they make financial data accessible to both professional and retail investors.
What makes them so important?
As can be seen from the information mentioned above, a tear sheet plays an important role in the corporate world. For instance, analysts use the document mentioned earlier to quickly screen potential investments and identify companies that meet specific criteria.
Moreover, financial advisors use tear sheets to present clients with brief and comprehensible summaries of investment options.
Besides, portfolio managers utilize tear sheets to keep an eye on and review the performance of their holdings efficiently. Lastly, Tear sheets can complement more detailed research reports, providing a summary that supports deeper analysis.
Limitations
Of course, a tear sheet also has its shortcomings.
For instance, they may need more depth for thorough analysis, requiring additional research.
Moreover, tear sheets represent data at a specific point in time, and rapid market changes can quickly render them outdated. Also, the selection of metrics and data presented can introduce bias, underlining certain aspects while neglecting others.
In conclusion, tear sheets are valuable tools in the finance industry, offering a streamlined approach to accessing and analyzing key financial data. Their concise format makes them ideal for quick decision-making, comparison, and client communication.
Nevertheless, investors should be aware of their limitations and use them as a starting point for deeper research and analysis. By effectively understanding and utilizing tear sheets, investors can enhance their ability to make informed and strategic investment decisions.
The post What is TEAR SHEET: Finance appeared first on FinanceBrokerage.


